Sankey Chart
A Sankey diagram allows creators to create flow visualizations by providing data that describes the flow between nodes.
Properties
Edge Data
The only data required to produce a Sankey diagram is the data describing the flow between nodes. This is captured by the Edge Data property, which expects an array of objects (JSON), which are of the form described by the following TypeScript interface:
export interface ISankeyEdge {
  /**
   * Node from which the point originates
   */
  from: string

  /**
   * Destination node of the edge
   */
  to: string

  /**
   * width of the sankey line in relative units
   */
  weight: number

  /**
   * Optional re-coloring (otherwise defaults to origin node color)
   */
  color?: string
}
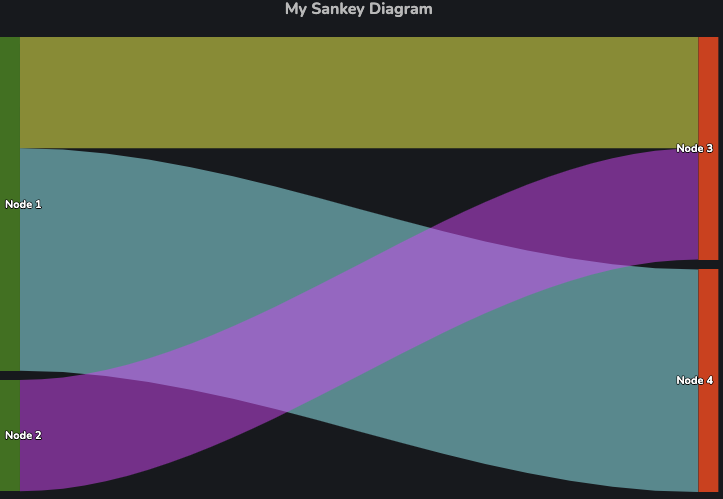
By providing the following data to Edge Data:
[
  {
    "from": "node1",
    "to": "node3",
    "weight": 1,
    "color": "rgb(255, 255, 0)"
  },
  {
    "from": "node1",
    "to": "node4",
    "weight": 2,
    "color": "rgb(0, 255, 255)"
  },
  {
    "from": "node2",
    "to": "node3",
    "weight": 1,
    "color": "rgb(255, 0, 255)"
  }
]
The following Sankey diagram is produced:
Node Data
(Optional)
Note how we were able to produce a Sankey diagram by simply specifying the flows through the Edge Data property. This is because Edge Data represents the minimal information required to construct the chart, assuming no customization of nodes is required.
However, there exist some use cases where one might want to explicitly provide data to describe nodes through the Node Data property:
- Giving nodes labels that differ from their
id(which are associated with thefromandtoproperties in anEdge Dataelement) - Explicitly specifying the color of certain nodes
- Moving nodes to a different level in the chart
The data expected as an input for Node Data is an array of objects describing the nodes. The schema for a single node is described by the following TypeScript interface:
interface ISankeyNode {
  /**
   * The id of the auto-generated node, referring to the `from` or `to` property of an edge.
   */
  id: string

  /**
   * Optional re-coloring (otherwise default colors are used)
   */
  color?: string

  /**
   * The label to display for a node. Defaults to the `id` of the node
   */
  name?: string

  /**
   * An optional level index of where to place the node.
   *
   * The default behavior is to place it one level up from the preceding node.
   *
   * Note that `level` is indexed from zero.
   */
  level?: number
}
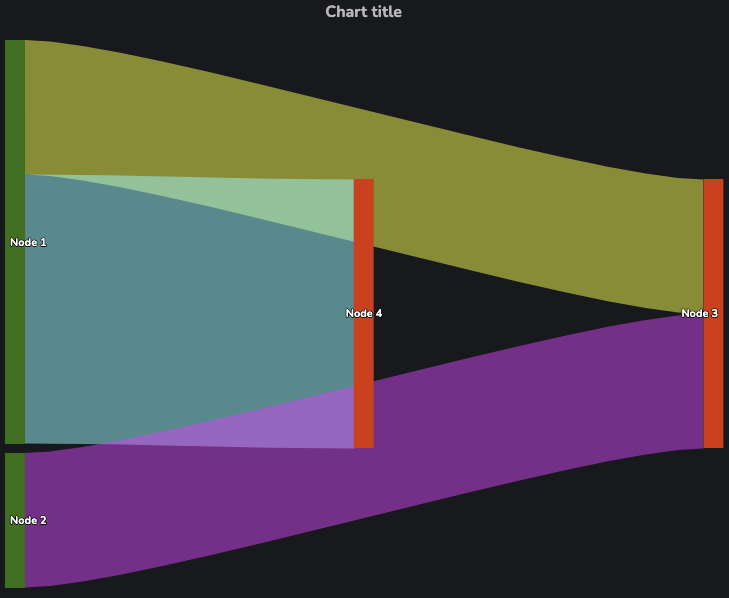
As an example, let's assume we want to rename all the nodes such that node<x> has the name Node <x>. On top of this, for our visualization, let's assume that it makes no sense to have Node 3 and Node 4 in the same level, so we will explicitly specify a level for Node 3 that places it in the right-most space. Our node config looks like so:
[
  {
    "id": "node1",
    "name": "Node 1",
    "color": "green"
  },
  {
    "id": "node2",
    "name": "Node 2",
    "color": "green"
  },
  {
    "id": "node3",
    "name": "Node 3",
    "color": "red",
    "level": 2
  },
  {
    "id": "node4",
    "name": "Node 4",
    "color": "red"
  }
]
This configuration produces the following chart:
Title
(optional)
The title text to be displayed above the chart.
Subtitle
(optional)
The subtitle text to be displayed below the chart title.
Selected Node
(optional)
This property is used to populate the store with the ID (string) of the selected point. The purpose of which is to drive other functionality in the Dais app that depends on the value of the selected point.
Selection Coloring / Selected Node Color
Selection Coloring is a boolean, which when set to true, will change the color of the selected node to visually distinguish it from those which are not selected. If Selected Node Color is set, then this color will be used; otherwise a default color from the chart theme will be used.
Adaptors
Table to Sankey
The purpose of this adaptor is to dynamically create edge data for the Sankey from an SDD data source. Nodes be configured as well through this adaptor, but since edges are the minimum information required to build the chart, this is optional.
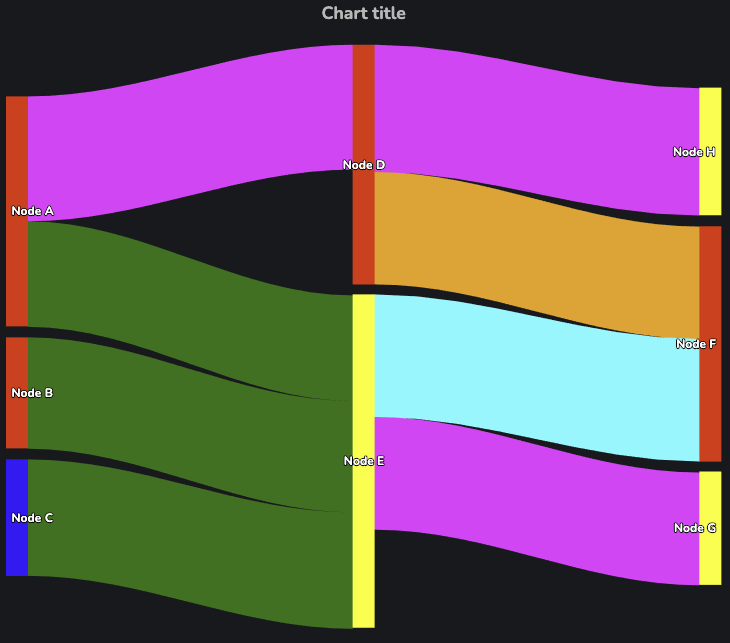
As an example, we will be constructing the following chart:
Configuring Edges
Edges Data
Edges Data should be linked to the SDD data source from which edges will be generated.
The following snippet shows the data supplied to Edge Data to construct the above chart:
{
  "data": [
    {
      "to": "D",
      "from": "A",
      "value": 53.51117318208754,
      "enumValue": "C"
    },
    {
      "to": "E",
      "from": "A",
      "value": 45.220140742977776,
      "enumValue": "A"
    },
    {
      "to": "E",
      "from": "B",
      "value": 47.740960430233805,
      "enumValue": "A"
    },
    {
      "to": "E",
      "from": "C",
      "value": 49.891362922452146,
      "enumValue": "A"
    },
    {
      "to": "H",
      "from": "D",
      "value": 54.559487848267416,
      "enumValue": "C"
    },
    {
      "to": "F",
      "from": "D",
      "value": 48.15654129902704,
      "enumValue": "E"
    },
    {
      "to": "F",
      "from": "E",
      "value": 52.5093408889447,
      "enumValue": "B"
    },
    {
      "to": "G",
      "from": "E",
      "value": 48.31832857559655,
      "enumValue": "C"
    }
  ],
  "version": "1.0.0",
  "sddFormat": "sdd/table/array-of-objects",
  "validation": "enforced",
  "definitions": {
    "to": {
      "kind": "string",
      "optional": false
    },
    "from": {
      "kind": "string",
      "optional": false
    },
    "value": {
      "kind": "number",
      "optional": false
    },
    "enumValue": {
      "kind": "string",
      "optional": false
    }
  }
}
Filters
The applicable/available filters in this adaptor are more similar to those found elsewhere in Dais:
Available Filtersmay be linked to an object that maps filter names to filter specification objects. These objects containkey, avalueand a filtermethod.Applicable Filtersare a list of filter names in the object supplied toAvailable Filtersto apply.
The supported values that can be provided to method are:
"equal""contains""between""lt""gt""lte""gte"
An example configuration could be:
{
  "ApplicableFilters": ["MyFilter", "MyOtherFilter"],
  "AvailableFilters": {
    "MyFilter": {
      "key": "y",
      "value": 50,
      "method": "gte"
    },
    "MyOtherFilter": {
      "key": "value",
      "value": [90, 180],
      "method": "between"
    }
  }
}
Edge From Key / Edge To Key / Edge Flow Key
As a minimum, the SDD data source for edges must include information for:
- The node from which each edge originates (where
Edge From keyspecifies the column containing this information) - The destination node for each edge (where
Edge To keyspecifies the column containing this information) - The relative size of the flow between these nodes (
Edge Flow Keydenotes this column, which must hold numeric data)
In the above example:
Edge From Keyis linked tofromEdge To Keyis linked totoEdge Flow Keyis linked tovalue
Coloring Edges (optional)
Edge Color Key and Edge Color Config are optional properties which allow the edges in the Sankey diagram to be set dynamically from data in the SDD. Edge Color Config contains a mapping between string values found in the column specified by Edge Color Key and colors to use to color the edges.
In our above example, Edge Color Key was mapped to enumValue (which can take the values A, B, C, D, E), and Edge Color Config linked to the following JSON:
{
  "kind": "colorMap",
  "config": {
    "mapping": {
      "A": "green",
      "B": "cyan",
      "C": "magenta"
    },
    "matchCase": true,
    "fallback": "orange"
  }
}
Edge Color Config expects an object with:
kindbeingcolorMap- a nested object
config, which contains an objectmappingwhich maps string values in the column specified byColor Keyto colors.
config also allows for the following optional configuration items:
matchCaseis a boolean which determines whether strings need to have the same case as the values inmappingto be mapped to colorsfallbackis a color to use in the event that a value in the column specified byColor keydoes not match any key inmapping.
Configuring Nodes (optional)
As stated previously, configuring edges is all that's needed to produce a Sankey diagram, meaning configuring nodes is optional. However, configuring nodes allows the creator to apply labels to nodes that are different from their ID (for readability) and customize their colors.
Nodes Data
Nodes Data should be linked to the SDD data source from which nodes will be generated. The SDD supplied to Nodes Data should at least include information per row that can be used to build the id and name of each node.
The following snippet shows the JSON provided to Node Data to produce the chart at the beginning of this adaptor's section:
{
  "data": [
    {
      "id": "A",
      "name": "Node A",
      "enumValue": "X"
    },
    {
      "id": "B",
      "name": "Node B",
      "enumValue": "X"
    },
    {
      "id": "C",
      "name": "Node C",
      "enumValue": "Z"
    },
    {
      "id": "D",
      "name": "Node D",
      "enumValue": "X"
    },
    {
      "id": "E",
      "name": "Node E",
      "enumValue": "Y"
    },
    {
      "id": "F",
      "name": "Node F",
      "enumValue": "X"
    },
    {
      "id": "G",
      "name": "Node G",
      "enumValue": "Y"
    },
    {
      "id": "H",
      "name": "Node H",
      "enumValue": "Y"
    }
  ],
  "version": "1.0.0",
  "sddFormat": "sdd/table/array-of-objects",
  "validation": "enforced",
  "definitions": {
    "id": {
      "kind": "string",
      "optional": false
    },
    "name": {
      "kind": "string",
      "optional": false
    },
    "enumValue": {
      "kind": "string",
      "optional": false
    }
  }
}
Filters
See Filters.
Node ID Key / Node Name Key
As a minimum, the SDD data source for nodes must include information for:
- The value to use for a node's ID (where
Node ID keyspecifies the column containing this information) - The value to use for the node's name (where
Node Name Keyspecifies the column containing this information)
In the above example:
Node ID Keyis linked toidNode Name Keyis linked toname
Coloring Nodes (optional)
Coloring nodes works in much the same manner to what was described in the section on coloring edges.
In the example above, Node Color Key was linked to enumValue, and the configuration for Node Color Config was linked to the following JSON:
{
  "kind": "colorMap",
  "config": {
    "mapping": {
      "X": "red",
      "Y": "yellow"
    },
    "fallback": "blue"
  }
}